Kurtosis
Kurtosis refers to the degree of flatness or peakness in the region of the curve. It is generally used to measure the degree of outliers that occur in the data, i.e., the tailedness of the distribution. Outliers are the values that lie at extreme distance from the other values of the sample. Tails refers to the ends on both sides of the distribution. It indicates the frequency of variables that are far away from the mean.
HOW TO CALCULATE?
Kurtosis is calculated by dividing the fourth central moment by the standard deviation raised to the power 4.
Kurtosis = 4 / 4
Excess kurtosis = kurtosis – 3
Fourth central moment is the fourth moment about mean which is given by
4= 1/N fi(xi – x )4
Standard deviation is used to measure how widespread our data values are from the mean, which is given by
= sqrt((xi – x )2/N)
Here, N = number of elements
x = mean
TYPES OF KURTOSIS
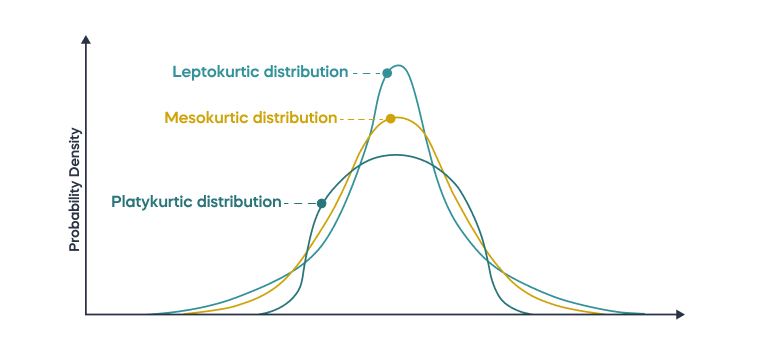
There are three types of kurtosis: mesokurtic, leptokurtic, and platykurtic.
-
Mesokurtic curve :
Mesokurtic curve is a medium tailed curve which means the outliers are neither too likely to occur nor too unlikely. It is measured on the basis of normal distribution. They have a kurtosis of 3 and the excess kurtosis is 0.
For example, a wildlife expert knows that the average birth weight of giraffes is 50-70 kgs. He collects data of 250 newborn giraffes and draws a distribution. It is unlikely that a lot of sample elements will be lower than 50 kgs or higher than 70 kgs.
-
Leptokurtic curve :
Leptokurtic curve is a fat tailed curve which means there are numerous outliers. It is more peaked when compared to the normal distribution. It has a kurtosis of more than 3 and the excess kurtosis is more than 0.
For example, if an investor evaluates a high-risk stock portfolio, there is an equal probability of a huge win and a big loss
-
Platykurtic curve :
Playkurtic curve is a light tailed curve which means the outliers are extremely rare. It is flatter when compared to the normal distribution. It has a kurtosis of less than 3 and the excess kurtosis is less than 0.
For example, if a school wants to analyse the performance of students between the age of 12 to 15 years. So, there is almost no chance of a student not being between 12 to 15 years of age.
DIFFERENCE
| Mesokurtic | Platykurtic | Leptokurtic | |
| Tailedness | Medium-tailed | Thin-tailed | fat-tailed |
| Outlier frequency | medium | low | high |
| Kurtosis | moderate | low(<3) | high(>3) |
| Excess kurtosis | 0 | negative | positive |
| Example distribution | normal | uniform | laplace |
EXAMPLE 1
For a mesokurtic distribution, the fourth central moment is 243. Find the SD of the distribution.
For a mesokurtic distribution : kurtosis = 3, excess kurtosis = 0
4 / 4 = 3
243 / 4 = 3
4 = 81
SD = = 3
EXAMPLE 2
Compute the kurtosis for the distribution : 16, 26, 12, 24, 56, 112
Mean = (16 + 26 + 12 + 24 + 56 + 112) / 6
Variance = [(16 – 41)2+ (26 – 41)2 + (12 – 41)2 + (24 – 41)2 + (56 – 41)2 + (112 – 41)2] / 6 = 1207.67
SD = sqrt(1207.67)
Fourth Moment = [(16 – 41)4 + (26 – 41)4 + (12 – 41)4 + (24 – 41)4 + (56 – 41)4 + (112 – 41)4] / 6 = 4449059.67
Kurtosis = 4449059.667 / (sqrt(1207.667))4 = 3.05
The distribution is leptokurtic as the kurtosis is more than 3.
EXAMPLE 3
Compute the kurtosis of the distribution: 20, 38, 42, 78, 26, 54
Mean = (20 + 38 + 42 + 78 + 26 + 54) / 6 = 43
Variance = [(20 – 43)2 + (38 – 43)2 + (42 – 43)2 + (78 – 43)2 + (26 – 43)2 + (54 – 43)2] / 6 = 365
SD = sqrt(365)
Fourth Moment = [(20 – 43)4 + (38 – 43)4 + (42 – 43)4 + (78 – 43)4 + (26 – 43)4 + (54 – 43)4] / 6 = 313209
Kurtosis = 313209/(sqrt(365))4 = 2.35
The distribution is platykurtic as the kurtosis is less than 3.